Soybeans · Humid Pampas · Sentinel-2
Is this soybean campaign going well or badly?
A satellite measures how green the soybeans are in each department and compares it with that department’s own history. When a campaign is poorer than others, it shows months before harvest.
81% of departments were already below normal on December 1, 2022. The 2022/23 campaign ended with yields 35% below each department’s average.
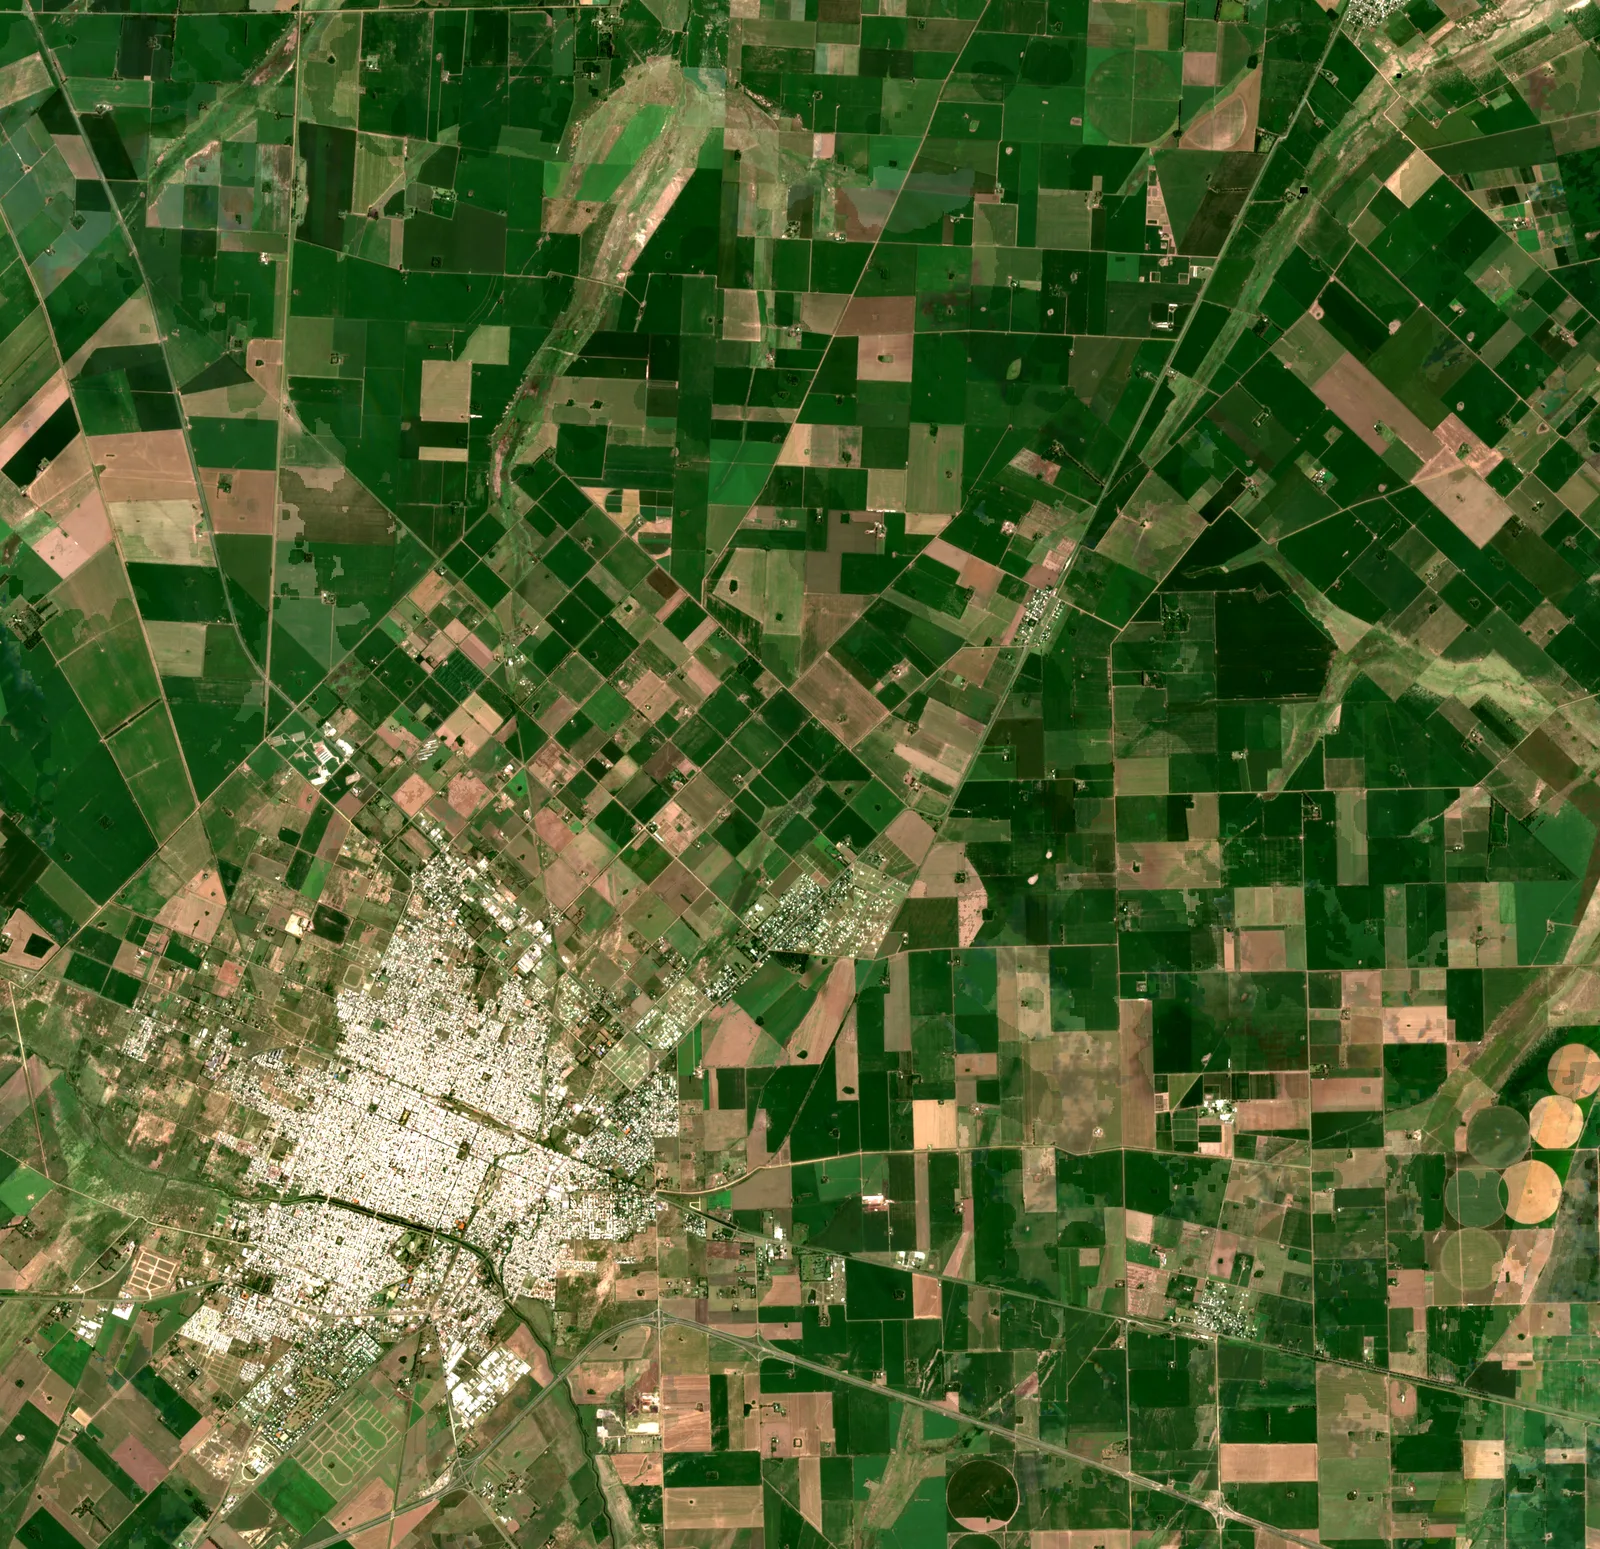
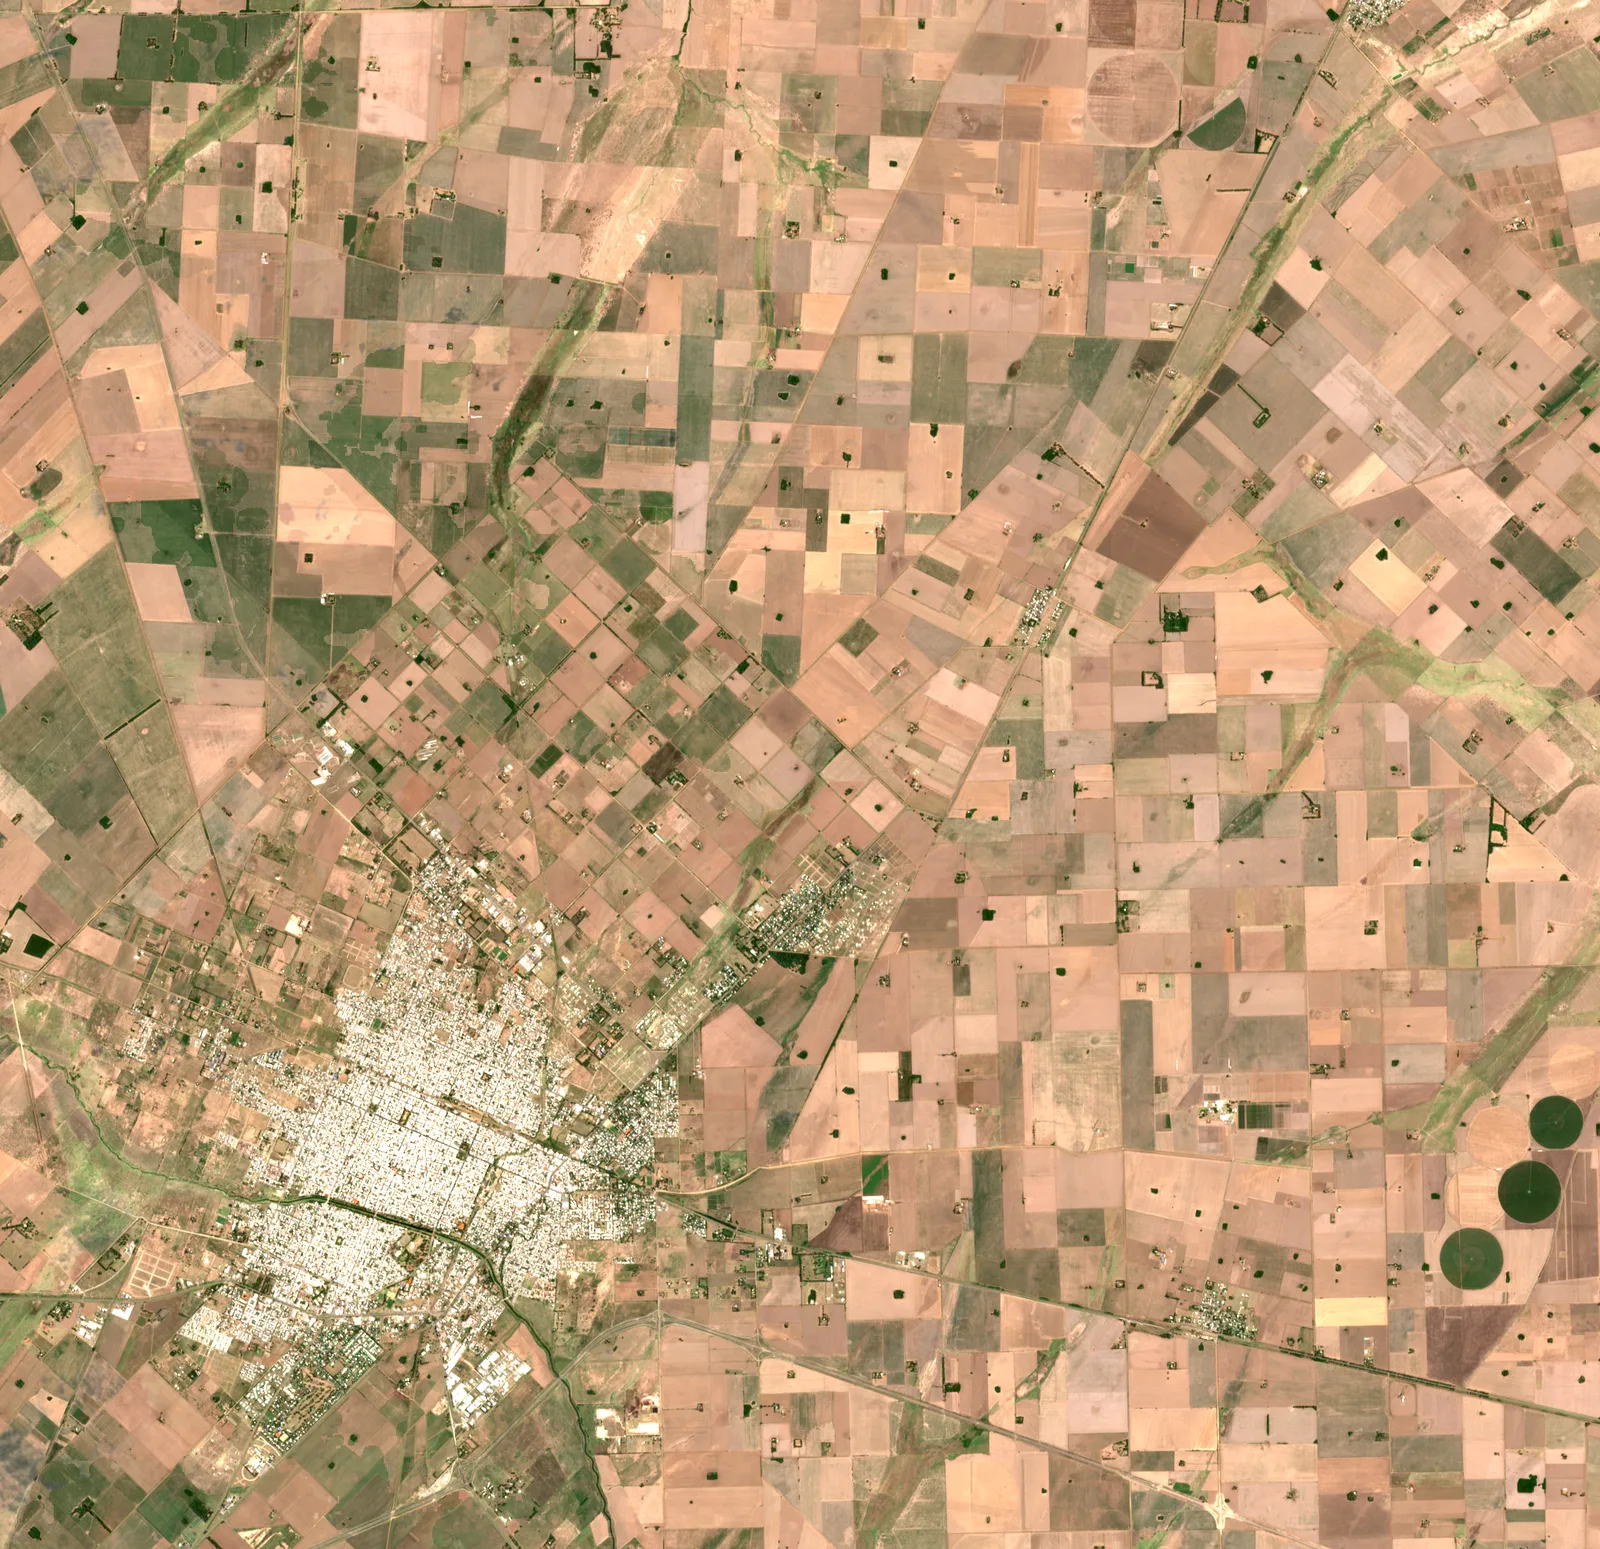 January 2023 · drought January 2024
 The monitor
How each department is doing against its own history
Pick a campaign and move the date: each department is coloured by its accumulated greenness against that of other campaigns on the same date.
Validation
How accurate is it?
We tested the method against MAGyP’s official yields: 7 campaigns (2018/19 to 2024/25) and 137 departments. Each campaign is evaluated without the method having seen its results.
The further along the campaign, the more accurate
Porcentaje de casos en que el satélite acertó si la campaña terminó por encima o por debajo de lo normal de cada departamento.
View the data as a table
| On | Clear signal | All cases | Clear-signal cases |
|---|---|---|---|
| November 1 | 50% | 51% | 79% |
| November 11 | 51% | 53% | 77% |
| November 21 | 54% | 53% | 74% |
| December 1 | 56% | 54% | 73% |
| December 11 | 59% | 58% | 71% |
| December 21 | 62% | 62% | 71% |
| January 1 | 67% | 63% | 74% |
| January 11 | 68% | 64% | 78% |
| January 21 | 71% | 65% | 73% |
| February 1 | 72% | 66% | 72% |
| February 11 | 73% | 67% | 69% |
| February 21 | 75% | 68% | 66% |
| March 1 | 78% | 68% | 65% |
| March 11 | 79% | 70% | 61% |
| March 21 | 80% | 72% | 57% |
| April 1 | 81% | 72% | 54% |
| April 11 | 81% | 71% | 52% |
| April 21 | 81% | 70% | 51% |
| May 1 | 82% | 70% | 49% |
| May 11 | 82% | 70% | 47% |
| May 21 | 82% | 70% | 47% |
accurate on March 1, when the anomaly is clear (more than 5% either way: 65% of cases).
of the times the model anticipates a yield more than 10% below normal, it is right (163 cases). Only 12% ended up above.
less error than using each department’s historical average. Without the 2022/23 drought, the improvement is 17%.
What you should know
- Early on it is hard. On December 1 accuracy is 56%, close to a coin flip. The 2022/23 drought showed up early (81% of departments in red that day) because it was very severe.
- That is 7 campaigns and a single drought. We do not know how it responds in other droughts.
- Near-normal is not judged. If the satellite sees a campaign within 5% of its history, the map shows it as normal and it counts as neither a hit nor a miss.
Model error by campaign
| Campaign | Model error | Historical-average error | Improvement |
|---|---|---|---|
| 2018/2019 | 459 kg/ha | 770 kg/ha | +40.4% |
| 2019/2020 | 384 kg/ha | 434 kg/ha | +11.7% |
| 2020/2021 | 381 kg/ha | 428 kg/ha | +10.8% |
| 2021/2022 | 327 kg/ha | 327 kg/ha | 0% |
| 2022/2023 | 633 kg/ha | 1352 kg/ha | +53.2% |
| 2023/2024 | 353 kg/ha | 414 kg/ha | +14.6% |
| 2024/2025 | 493 kg/ha | 416 kg/ha | -18.5% |
Root-mean-square error (RMSE) in kg/ha of the department yield estimate, validated leaving one campaign out at a time.
The method
How it works
-
The satellite looks at soybeans, not the whole field
Sentinel-2 (the European Space Agency’s Copernicus programme) passes every 5 days. We use only the pixels INTA mapped as soybean that year, so it is not mixed up with maize, woodland or pasture.
-
One greenness curve per department
From those pixels we get a vegetation index (NDVI) every 10 days, cloud-free and smoothed. It measures how much green soybean there is and when.
-
Compared with its own history
Each date is set against the same date in the department’s other campaigns. The difference is the anomaly: more than 5% below, the campaign is going badly; more than 5% above, it is going well.
-
Checked against official yields
A model that adds rainfall and heat estimates yield and is validated against MAGyP, always leaving out the campaign being evaluated. If it does not beat the historical average, the result is shown anyway.
The code, tests and full methodology are in the repository.